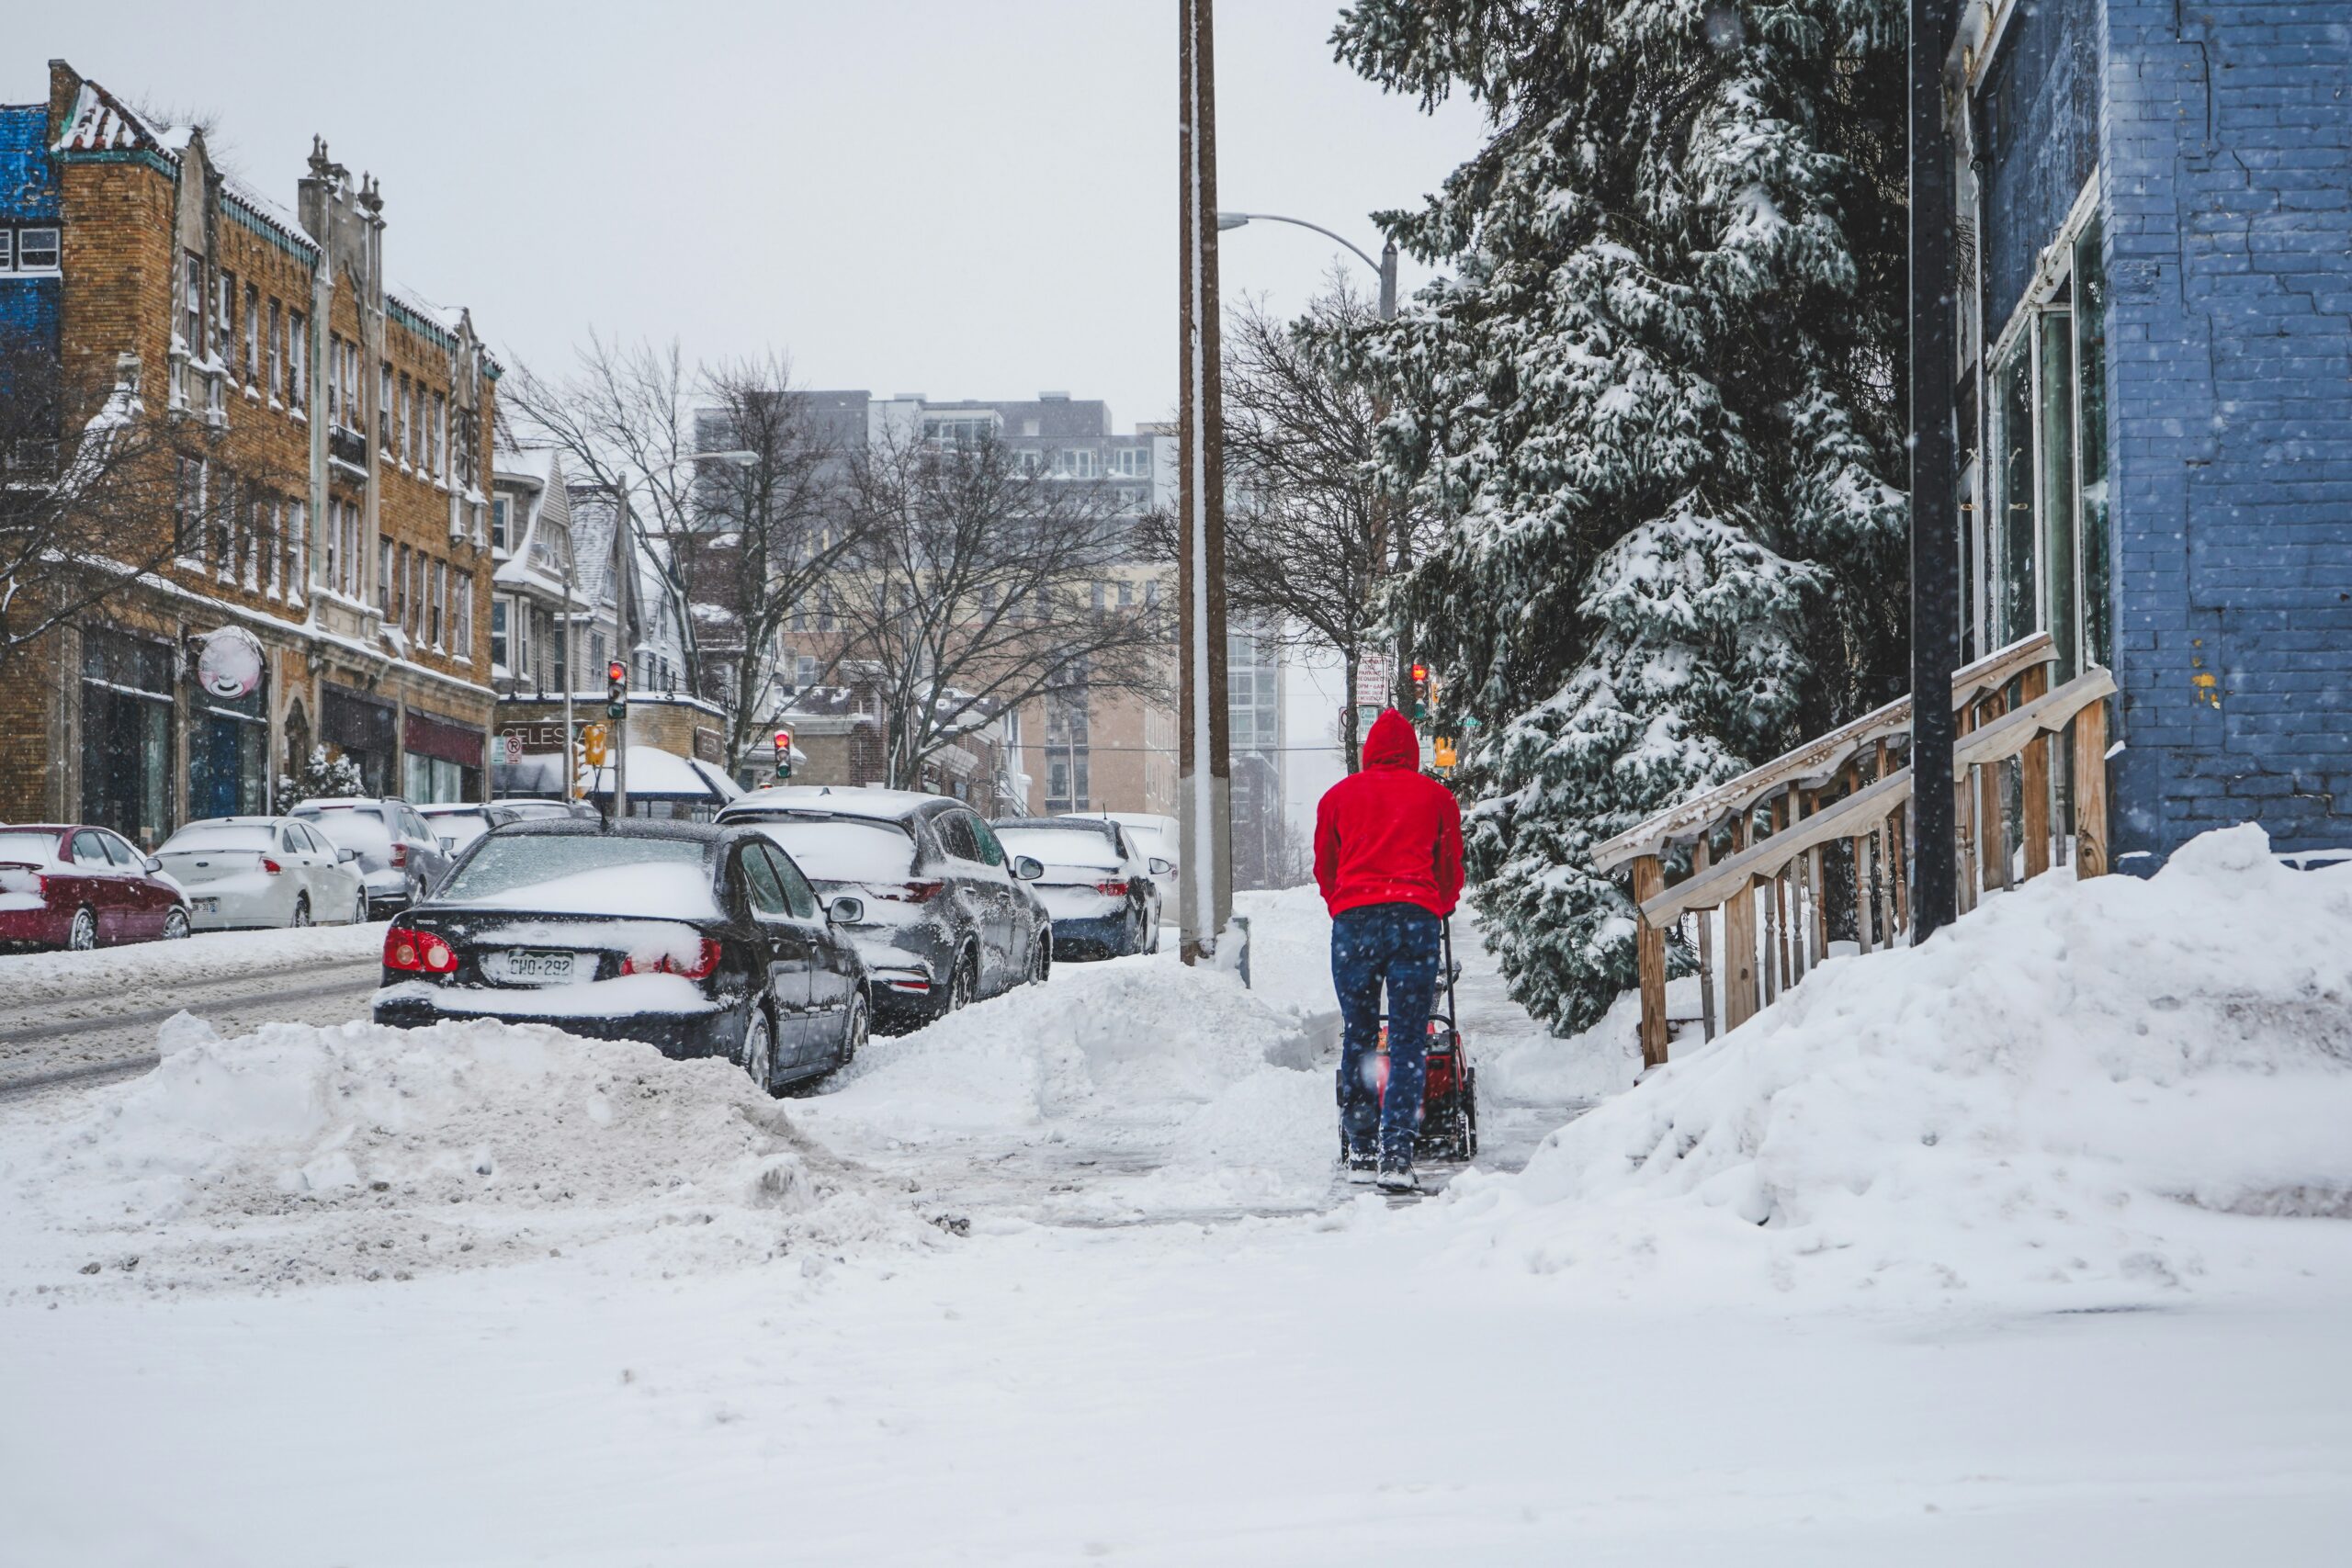
Natural Gas Local Distribution Companies (LDCs) are expected to be able to provide natural gas to their customers every day of the year. The demand for natural gas is lower, generally, in the summer months, and peaks in the cold winter months. This is due to the prevalence of natural gas used as a fuel source to heat homes, businesses, and other types of indoor spaces in the winter. As such, the capacity to which utilities design and construct their natural gas distribution systems is based on that coldest possible winter day. The failure to meet that high demand would (and has in the past) result in life-threatening scenarios where people are not able to maintain healthy living conditions in their homes.
Yet, there is a balancing concern that arises. Natural Gas distribution infrastructure is not cheap to develop. It requires permitting and approval from regulatory bodies. Utilities need to justify the development of their systems, and show that they are being both prudent, (acting with thought for the future) and reasonable (not excessively building up infrastructure).
A utility in Florida can expect a different winter demand than one in South Dakota. A large system that feeds a city can expect a different demand than one that provides gas to a series of small towns. Yet, the utility in Florida should still be prepared to provide heat to homes in the rare case of a cold winter day. The utility in South Dakota should not have so much infrastructure that the business case cannot be justified. This varied nature of the question provides a problem: How can we, as a utility, know how much demand can be reasonably expected on that coldest day for our service area?
Marquette Energy Analytics aims to answer this question with our Design Day Study.
What is a Design Day?
A design day is the theoretical day with the highest expected demand that your system must be designed to deliver. It is different than a peak day, in that a design day is a representation of the coldest day in some number of years. For example, a common measure to set one’s design day is the coldest day in thirty years, although some utilities choose fifteen years, some choose a specific day where the load was particularly concerning, and others have their design day determined by their regulator. We wrote a blog that discusses these “Design Day Conditions” which you can read by clicking here.
What is a Design Day Study?
A Design Day Study is a service that MEA provides to natural gas utilities that determines what the design day conditions are and what the gas demand would be on a day with those conditions. This is useful for utilities that are trying to be both prudent and responsible, as getting this report from an independent third party allows for a transparent and unbiased estimate of the greatest demand that a system can reasonably be expected to meet. Marquette Energy Analytics is a particularly excellent choice to develop and deliver this report, as our work has already been used in many public filings and, as such, has been shown to be the industry standard. We’ve developed over forty Design Day Studies, so we have a lot of experience with what is expected to be delivered.
The report is delivered in three parts:
- The DDS Narrative Document
- The DDS Executive Summary
- The DDS Workbook
In this post, we’ll look at the DDS Narrative Document.
DDS Narrative
The MEA Design Day Study Narrative document’s purpose is to provide clarity regarding the process and inputs used to generate the Design Day numbers. It includes sections on how we collect the data, how we calculate the Design Day Condition, how we detrend historical data to account for customer growth and/or shrinkage, how we factor in changes to customer composition and behavior, and it describes the models used to calculate and forecast the Design Day demand.
It begins with a piece that is pulled to form the second delivered part, The Executive Summary.
In The Executive Summary, MEA lays out the key takeaways from the work. This includes the Design Day Condition that was used for the study. MEA will record the weather condition that is represented by the condition, in both TempW, or wind adjusted degrees Fahrenheit, and in HDDW, wind adjusted heating degree days. If the HDDW is 90, for example, we are saying that MEA expects one day that is at least 90 HDDW to occur every thirty years.

The next section in the Executive Summary is the Forecast by Winter. The forecast by winter is a table of forecasted values that extends the Design Day Condition out to a specific range. As you can see in the table below, we show a snippet of the forecasted Design Days in this executive summary. More years, up to ten years in the future, can be found in The DDS Workbook.

Another aspect of the above table is the 99% confidence demand row. This 99% confidence forecast represents the demand for which there is a 99% probability that the actual demand will not exceed if the Design Day Condition occurs.
Why is the Design Day Demand and the 99% Confidence demand different?
The calculated Design Day demand points to a single value. MEA seeks to determine this single value as it represents the most likely scenario of gas demand that will be required on a Design Day event. In turn, the Design Day Demand forecast is a confidence forecast, one that has an equal chance of being exceeded and not met on the design day. This equal chance number provides guidance that can help form the basis for planning, and whether the forecast is high or low will be determined by the features of the customer base and the weather event that drives the temperature down to such an extreme level.
Calculation of Design Day Conditions
The second part of the DDS Narrative is the Calculation of Design Day Conditions.
As mentioned earlier, we have a blog on Design Day Conditions (DDC) that provides a good background on this subject. You can find that blog here.
Some utilities have a DDC that is determined internally or by their regulator, but for those that don’t MEA performs a statistical analysis of historical weather for their territory to determine the probability of various weather scenarios.
Let’s look at a common DDC, the 1-in-30-year event. This DDC refers to the coldest expected weather event that will statistically occur once every thirty years. There is (these numbers are rounded to the nearest whole number) a 3% chance of the event happening any given year and a 64% chance of it occurring once in a 30-year period. There is a 97% chance of it not occurring in any particular year and a 36% chance of it not occurring at all in a thirty-year period.
Different parts of the country, and different regulating bodies, require different security of operational planning from their utilities, and some utilities have supply constraint, so some utilities may choose a more common event like a 1-in-10-year event or a more rare event like a 1-in-50-year event to better meet the needs of the constraints particular to their territories.
The DDS Narrative then defines the Weather Data Set that was used for this analysis. For example, many of our customers get their weather data from AccuWeather, supplemented with data from the US National Oceanic and Atmospheric Administration (NOAA). We’ll point out how far back the weather set goes.
The weather used for our calculations is the daily average temperatures aligned to the gas day.
What weather stations do you use?
In our report, we describe our method of a Weighted Combination of Weather Stations. We do this weighted combination because most areas do not have a centrally located weather station that represents the weather for the entire territory.
In this case, using multiple weather stations often works to produce better forecasts than a single weather station. For instance, we might want to look at the weather from an airport just east of a city and another weather station just west of a city to get a better understanding of the weather experienced in the middle of the city where the demand is greatest. Sometimes, the stations we find that are the best for forecasting a territory sit a little outside of the territory that we are forecasting. This is a normal occurrence and can be explained by geographical barriers, imperfect sensors, elevation, and/ or many other obstacles.
How do you determine the weights for each weather station?
Our team looks at what weights result in the greatest minimization of error when modeling the natural gas demand. We focus on minimizing Root Mean Squared Error, a type of error metric that represents the accuracy of regressions used to model demand and emphasizes the reduction of large errors. Our optimization process is iterative, or a step-by-step approach where each successive step is informed by the previous step. This process allows us to slowly “walk it in” towards the optimal weighting.
The table below shows how this weather station combination is presented in our report:

Wind Adjusted Heating Degree Days (HDDW)
Wind chill can have a large impact on the felt temperature of the day. You might have experienced this in winter, where the temperature is positive, but with wind chill, the perceived temperature is negative. Wind wicks away the heat around the body, causing more heat loss. Similarly, buildings lose more heat on windier days. Due to this, furnaces will require more natural gas to heat spaces on windier days.
By including wind in MEA forecasts, we have found significant improvements to our accuracy in demand estimates and forecasts (especially at colder temperatures). HDDW approximates this effect.
The equation below is used to calculate HDDW:
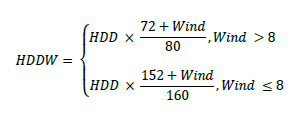
The DDS Narrative will include a graph that shows the relationship between temperature, wind, and HDDW using historical weather.
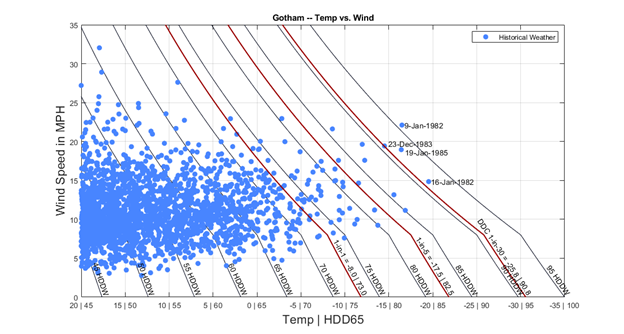
Each dot represents a day of weather with temperature on the x-axis and wind on the y-axis. The red line in the plot represents all combinations of temperature and wind that produce the 1-in-30 DDC. Dots to the right of or above the red line are more extreme than the DDC.
In the example above, the coldest day in the dataset, in terms of temperature or HDD was January 16th, 1982. This day had about 92 HDDW. However, our model assumes that because January 9th, 1982 was much windier, that January 9th likely represents a more extreme effect on the natural gas demand as it had a greater HDDW value at around 96 HDDW.
Acquisition and Validation of Load Data
This section of the DDS Narrative explains how MEA got the data provided for the study. It will describe errors that were found and corrected and omissions that were made to the data set, if any. All edits made to the data set will be made in consultation with the utility that receives the report. Lastly, it will give the date range for the data included, aligned to the gas day.
Detrending Load Data
When receiving data, we aim to use a long history because a longer history has a higher chance of including examples of historical extreme cold weather events. Yet, the natural gas that was used during those historical events will reflect the natural gas system’s behavior of that time. If it is unadjusted, forecasts made using that data as an input may cause an understated or overstated demand due to the system’s growth.
To make the adjustment, MEA has developed some of the best-in-class techniques for detrending historical natural gas data. This detrending allows us to adjust older historical load data to behave like current customer characteristics to account for growth in the customer base, energy efficiency measures, changes in customer composition, etc. We use regression models to fit “windows” of historical data. The change in the baseload term and heatload terms of the model across different windows of data is used to observe how much the customer characteristics, such as baseload and headload (use per HDDW), have changed.
Design Day Forecasting Models
The next section focuses on the specifics of what models are used to create the design day forecast. MEA uses multiple models to produce a variety of estimated design day numbers. These numbers are then combined at different weights to arrive at the final design day number. This technique, ensemble forecasting, has been shown to be more accurate than a singular forecast and is a well-accepted practice in the forecasting field.
For specifics on what models we use and how we weigh them, reach out to our team!
Summary of Design Day Demand for Prior Years
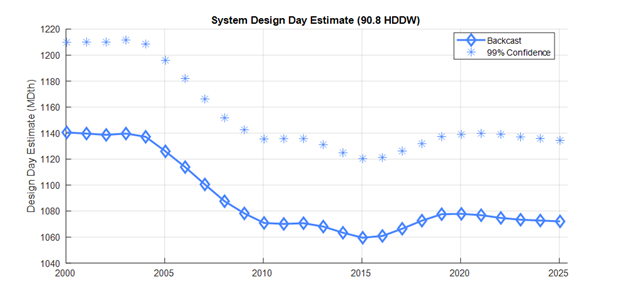
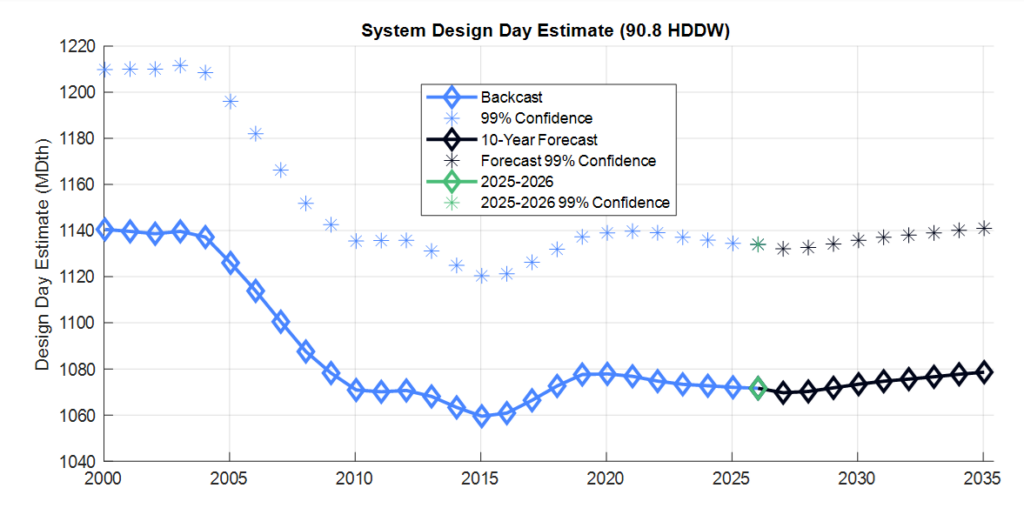
While the main result of the DDS Report will be a forecast of what can be expected if a design day was to occur, we do also provide a backcast, or a backwards forecast, of what the Design Day Demand would have been if the Design Day Condition had occurred in the last five winters.
The chart and graph below show what the Prior Winter Design Days would have been, but more estimates going further back can be found in the DDS Workbook.

Design Day Growth Estimate for the Next Heating Season
By evaluating current trends in baseload, heatload, and usage per customer, MEA calculates the expected Design Day and the 99% Confidence forecast.
The standard forecast is the expected demand if the Design Day Condition weather event occurs (in this example, a 1-in-30 year weather event). Assuming a normal distribution, there is a 50% probability that demand will exceed the forecast, and accordingly, a 50% chance that demand will be below the forecast.
The 99% confidence forecast includes an upward adjustment of the Design Day forecast by 2.5 standard deviations of the Gaussian mixture model ensemble, which produces a forecast with an approximately 99% confidence level. This means that if a 1-in-30 weather event occurs, there is a 99% probability that the demand will not exceed the 99% confidence forecast.
The choice to use the standard Design Day forecast or the 99% confidence forecast depends on the level of reliability needed from the forecast.
Design Day Growth Ten-Year Forecast
MEA forecasts the Design Day growth out ten years. We use a long-term forecasting model to forecast changes in the baseload and heatload with an ensemble of models that fit the historical data with linear and exponential trends of both the baseload and heatload demand. Additionally, we incorporate economic components into the forecast.
The ten-year forecast can be found in the DDS Workbook.
Design Day Forecast Summary
This concluding section shows the results of the Design Day Study. It includes a table of values and a chart that shows a combination of backcasted and forecasted design days by winter.

Closing
Thanks for exploring our Design Day Study Narritive document with us! Our 2025 spring Design Day Study Calendar is nearly full, so if your utility could benefit from a new or refreshed DDS, reach out to your MEA contact or use the contact form below!


